
Post Written By Jackson Briar
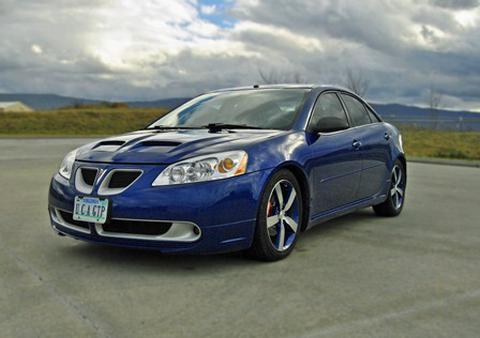
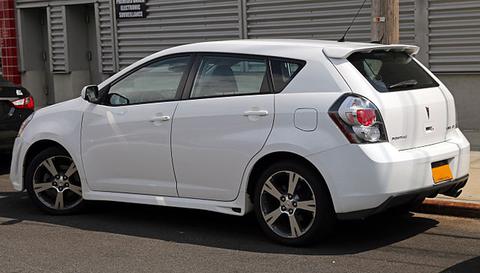
Is Costco Gas Bad For Your Car? Debunking Myths About Its Effects on Cars
Vehicle Specification Lookup Tool🔍
Find and filter vehicles by technical specifications.
Add filters to find all 2025 vehicles with over 300 hp and a second row headroom over 30 inches.
A 2010 Chrysler PT Cruiser has a forecasted 5 year depreciation rate of 5%.
In 5 years its value is expected to decrease approximately $176 from its current price of around $3,525 down to $3,349.
| Make & Model | Chrysler PT Cruiser |
|---|---|
| Current Value | $3,525 |
| Forecasted 5 Year Depreciation Rate | 5% |
| Forecasted Value Lost In 5 Years | $176 |
| Residual Value In 5 Years | $3,349 |
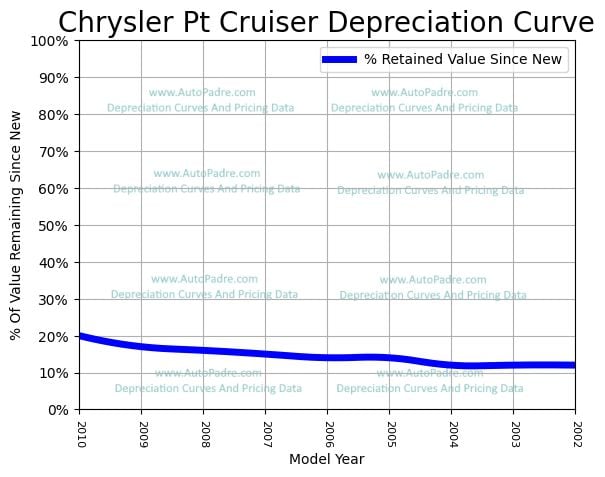
Current Retained Value Percentage VS. Model Year
Gaps in data could indicate no model released for that year.Get a custom depreciation graph of a Chrysler PT Cruiser based on model year and mileage driven!
Below is a historical table for the Chrysler PT Cruiser that displays year by year depreciation data.
| Model Year | Price When New | (%) Current Depreciation | ($) Current Depreciation | Current Residual Value |
|---|---|---|---|---|
| 2010 | $18,275 | 81% | $14,750 | $3,525 |
| 2009 | $20,780 | 84% | $17,380 | $3,400 |
| 2008 | $19,108 | 82% | $15,746 | $3,362 |
| 2007 | $19,708 | 84% | $16,470 | $3,238 |
| 2006 | $19,392 | 85% | $16,392 | $3,000 |
| 2005 | $19,405 | 86% | $16,630 | $2,775 |
| 2004 | $20,385 | 87% | $17,835 | $2,550 |
| 2003 | $20,195 | 88% | $17,770 | $2,425 |
| 2002 | $18,165 | 88% | $15,915 | $2,250 |
| 2001 | $15,935 | 88% | $14,060 | $1,875 |
| Make / Models | Forecasted Depreciation | - |
|---|---|---|
| (Selected) 2010 Chrysler PT Cruiser | 5% |
|
|
9% |
|
|
|
13% |
|
|
|
8% |
|
|
|
5% |
|
|
|
4% |
|
|
|
6% |
|
|
|
6% |
|
|
|
5% |
|
|
|
9% |
|
|
|
14% |
|
|
|
9% |
|
|
|
5% |
|
|
|
6% |
|
|
|
6% |
|
|
|
7% |
|
|
|
10% |
|
Post Written By Jackson Briar
Is Costco Gas Bad For Your Car? Debunking Myths About Its Effects on Cars
Post Written By Jackson Briar
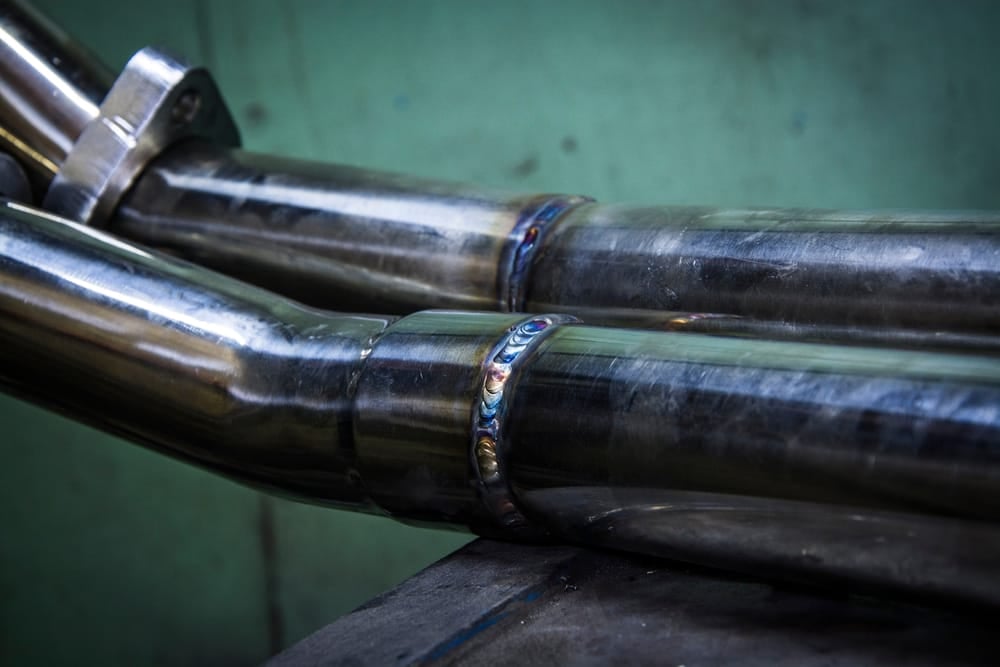
How To Straight Pipe A Car: Straight Piping Your Car for Enhanced Performance & Sound
Post Written By Jackson Briar
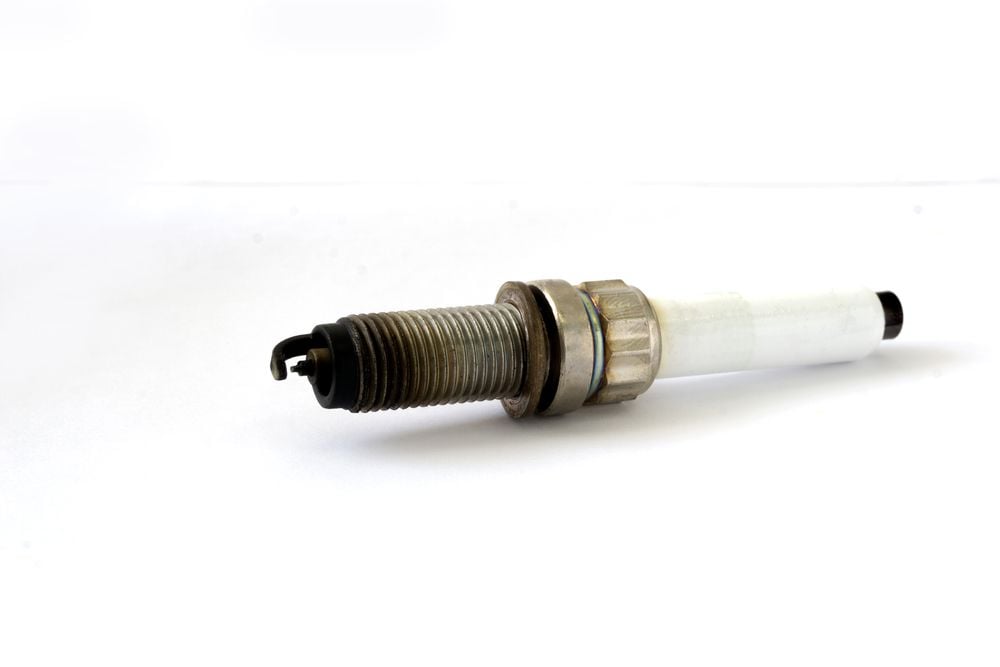
Car Feels Sluggish When Accelerating No Check Engine Light? Troubleshooting No-Alert Issues
11) Honda CRV
13) Porsche 911
14) Toyota Camry
15) BMW X5
16) Porsche Macan
17) Toyota Corolla
18) Toyota Tacoma
19) Audi A4
20) Audi Q5
21) BMW X3
22) Kia Stinger
23) Porsche Cayenne
24) Subaru Outback
26) Audi Q7
27) Audi R8
28) BMW M2
29) Jaguar F-Type
30) Kia Telluride